As economy rebounded, Bay Area rental costs outpaced national average
It is viscerally obvious to Bay Area residents — or anyone trying to hold on to a Bay Area residence — that the price of housing is out of control. Displaying government price data in new ways can begin to show how severe the problem has become.
There is no perfect set of numbers to show how housing costs have bloated, causing many to cut back on other expenses, dip into savings or ship out of the region. But the Bureau of Labor Statistics keeps records of prices for scores of categories of goods and services that can be compared over time, and across regions.
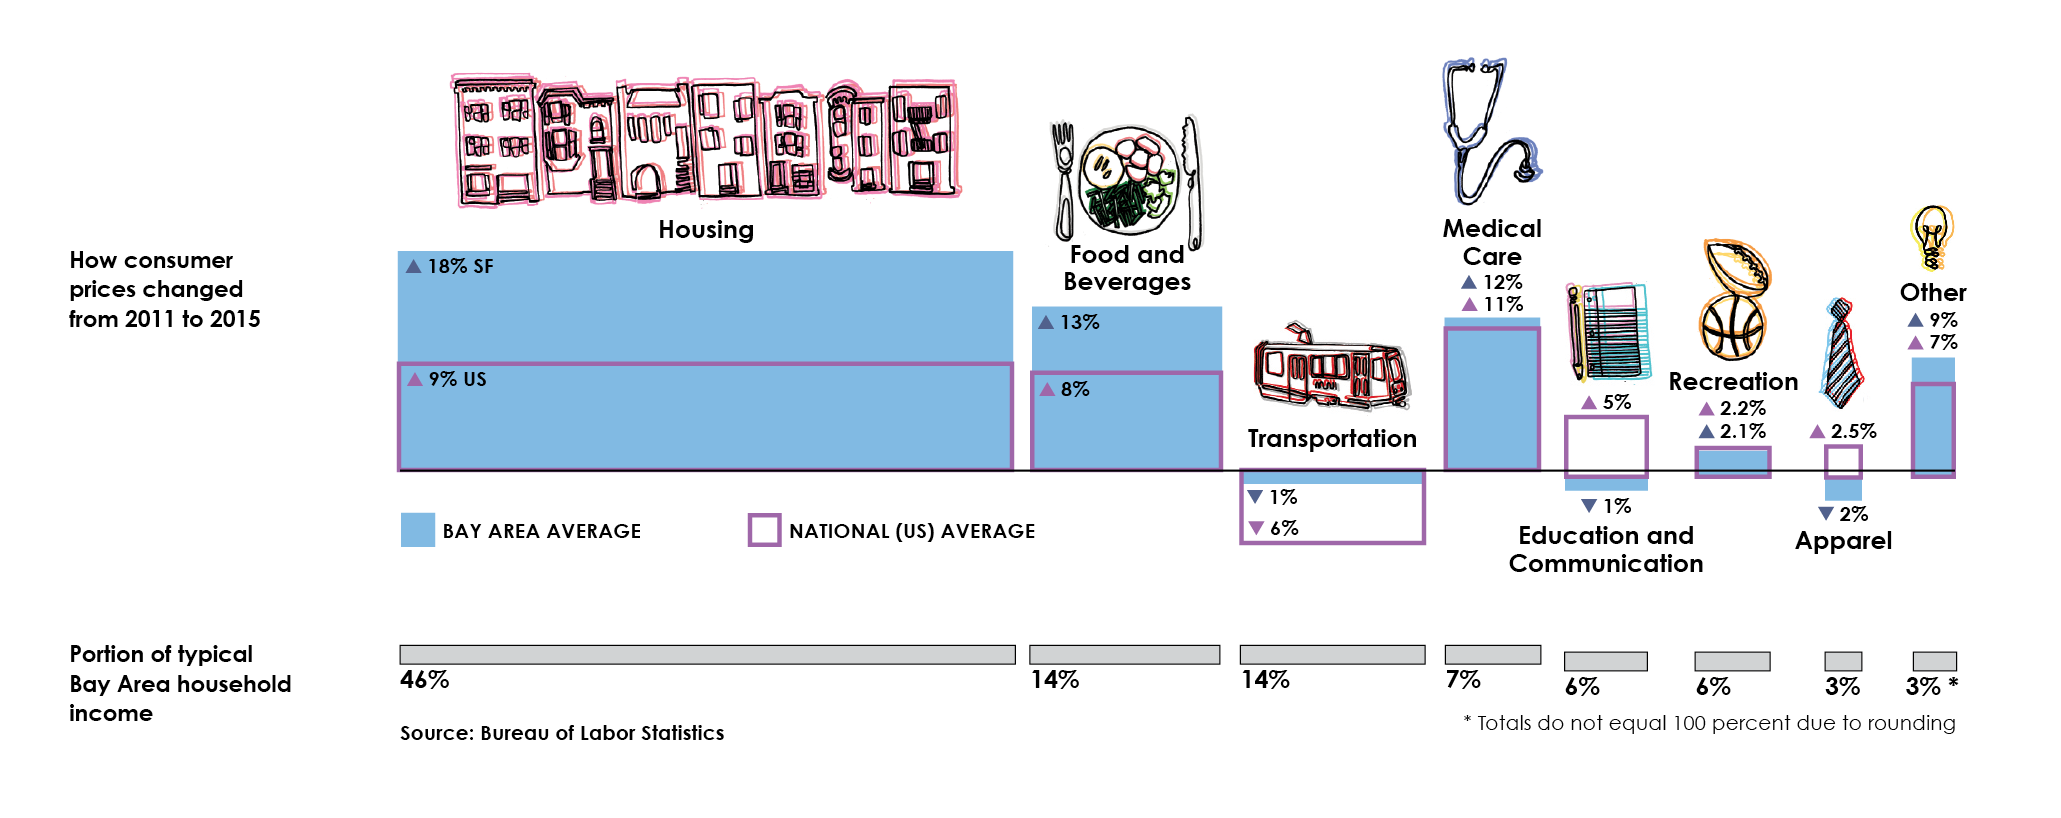
In the Bay Area, spending on housing has grown at twice the national rate. Medical care has grown almost as fast, but does not represent nearly as much of a typical household budget.
Overall, the consumer price index rose by 5.2 percent nationwide, but 10.8 percent in the Bay Area, from August 2011 to August 2015, the most recent data available at press time.
This graph makes several other comparisons. The horizontal axis shows the relative weight of eight major categories of expenditures, adding up to 100 percent. The vertical axis shows the change in prices.
Taken together, the weight (or what the statisticians call “importance”) and change over time show which categories of goods and services are taking the biggest economic bite out of the region’s average household.
Though this graph tracks changes from 2011 to 2015, for simplicity the weighting of goods and services by importance was set by price surveys in 2011.
There are two big limitations of the data.
First, because spending behavior and income sources are unique to each individual, there is no such thing as an “average” consumer — even though myriad economic policies, including cost-of-living adjustments, are set using variations of the consumer price index (see story here).
Second, numerous real estate databases and municipal surveys show that housing prices in San Francisco have risen faster than anywhere in the Bay Area, with the possible exception of San Jose. But the government aggregates price data across the nine counties of the Bay Area plus Santa Cruz, making it difficult to tease out exactly how bad San Franciscans have it, and how much a truly local version of the consumer price index would have to be raised to make it more accurately reflect the city’s recent crisis in housing affordability.
This article is part of a special reporting project on the cost of living in the Winter 2016 print edition of the Public Press.