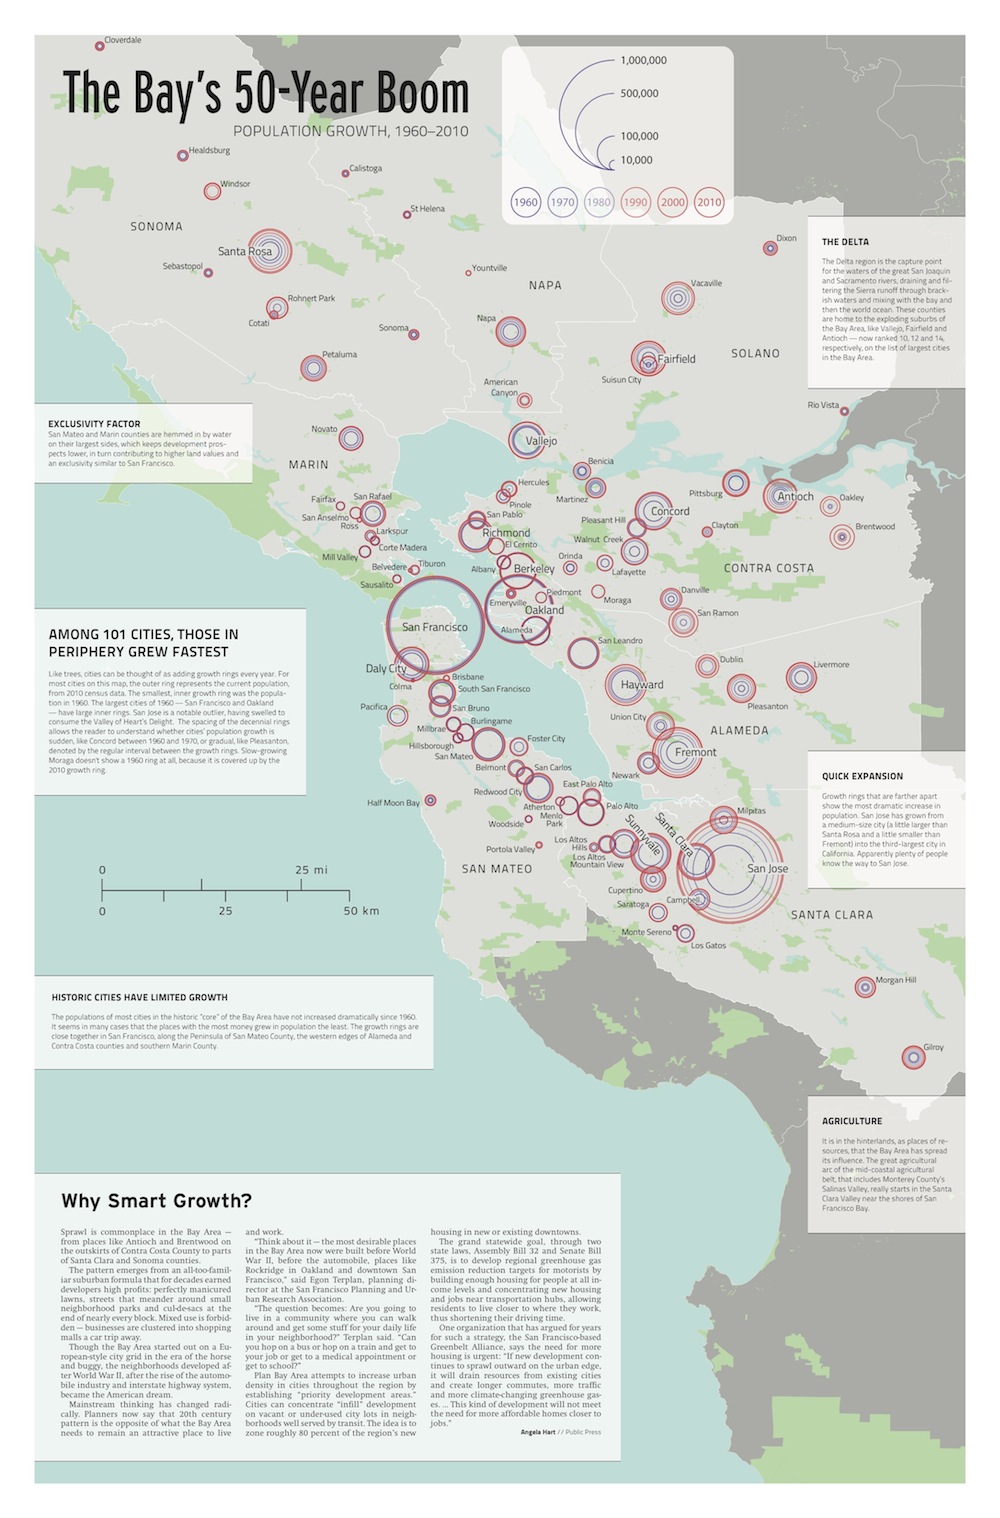
Among 101 cities, those in periphery grew fastest
Like trees, cities can be thought of as adding growth rings every year. For most cities on this map, the outer ring represents the current population, from 2010 census data. The smallest, inner growth ring was the population in 1960. The largest cities of 1960 — San Francisco and Oakland – have larger inner rings. San Jose is a notable outlier, having swelled to consume the Valley of Heart’s Delight. The spacing of the decennial rings allows the reader to understand whether cities’ population growth is sudden, like Concord between 1960 and 1970, or gradual, like Pleasanton, denoted by the regular interval between the growth rings. Slow-growing Moraga doesn’t show a 1960 ring at all, because it is covered up by the 2010 growth ring.
View full-size map
See related map: Map: Where we live now — 2010 household density and priority development areas
* * *
HISTORIC CITIES HAVE LIMITED GROWTH
The populations of most cities in the historic ”core” of the Bay Area have not increased dramatically since 1960. It seems in many cases that the places with the most money grew in population the least. The growth rings are close together in San Francisco, along the Peninsula of San Mateo County, the western edges of Alameda and Contra Costa counties and southern Marin County.
THE DELTA
The Delta region is the capture point for the waters of the great San Joaquin and Sacramento rivers, draining and filtering the Sierra runoff through brackish waters and mixing with the bay and then the world ocean. These counties are home to the exploding suburbs of the Bay Area, like Vallejo, Fairfield and Antioch — now ranked 10, 12 and 14, respectively, on the list of largest cities in the Bay Area.
EXCLUSIVITY FACTOR
San Mateo and Marin counties are hemmed in by water on their largest sides, which keeps development prospects lower, in turn contributing to higher land values and an exclusivity similar to San Francisco.
AGRICULTURE
It is in the hinterlands, as places of resources, that the Bay Area has spread its influence. The great agricultural arc of the mid-coastal agricultural belt, that includes Monterey County’s Salinas Valley, really starts in the Santa Clara Valley near the shores of San Francisco Bay.
Sources: 2010 census, Association of Bay Area Governments
Read full coverage of Bay Area smart growth in the San Francisco Public Press Summer 2012 print edition, on sale at retail outlets around San Francisco and online.
