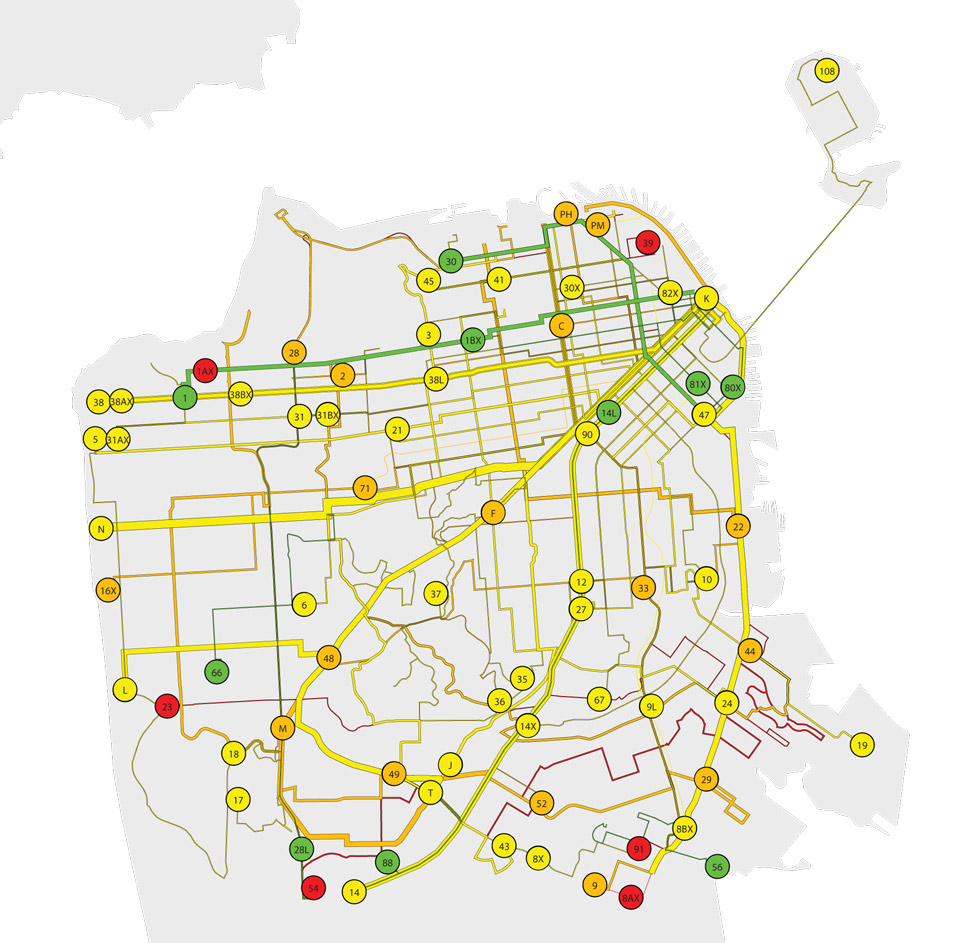
This map shows which San Francisco transit routes have the highest ridership and which adhere most closely to their schedules. Color indicates on-time performance; thickness of the lines indicates ridership.
The 1-California and 30-Stockton, traversing San Francisco’s northern flank, are high-ridership lines (green), with 80 percent or better schedule adherence.
The J-Church, K-Ingleside, T-Third, L-Taraval, and N-Judah Muni Metro lines, and the 14-Mission and 38-Geary bus lines, also have high reliability, with 70 percent or better schedule adherence (yellow).
In this view, the problem lines stick out: orange lines are on time 60 to 70 percent of the time. Red is on time less than 60 percent of the time. On-time performance data comes from Muni’s Fiscal Year 2010 On-Time Performance report.
The thickness of each line is proportional to the ridership of the line according to somewhat older data — the Transit Effectiveness Project, measured from October 2006 through June 2007.
The route shown for each line comes from Muni’s General Transit Feed Specification schedule data, effective Sept. 4, 2010. The outline of the city is from the Bay Area Outline file (Aug. 1, 2005) published on datasf.org.
A version of this article was published in the fall 2010 edition of the San Francisco Public Press newspaper. Read select stories online, or buy a copy.
This story was made possible with funding through micro-donations via Spot.Us.